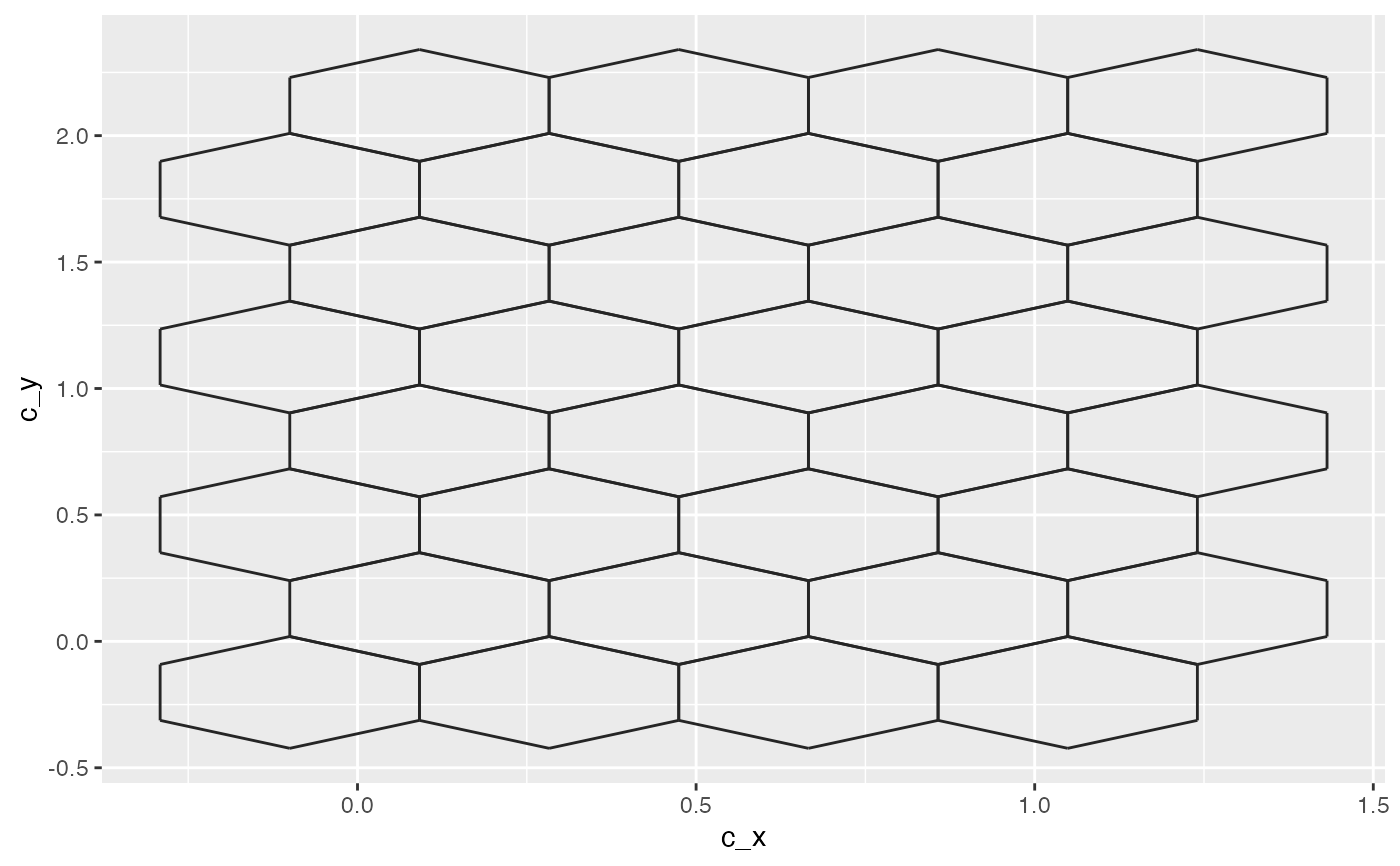
Create a hexgrid plot
Usage
geom_hexgrid(
  mapping = NULL,
  data = NULL,
  stat = "hexgrid",
  position = "identity",
  show.legend = NA,
  na.rm = FALSE,
  inherit.aes = TRUE,
  ...
)
Arguments
- mapping
Aesthetic mappings for the plot.
- data
The data to be plotted.
- stat
The statistical transformation to be applied.
- position
The position adjustment to be applied.
- show.legend
Whether to show the legend for this layer.
- na.rm
Whether to remove missing values.
- inherit.aes
Whether to inherit aesthetics from the plot or the layer.
- ...
Additional arguments to be passed to the `layer` function.