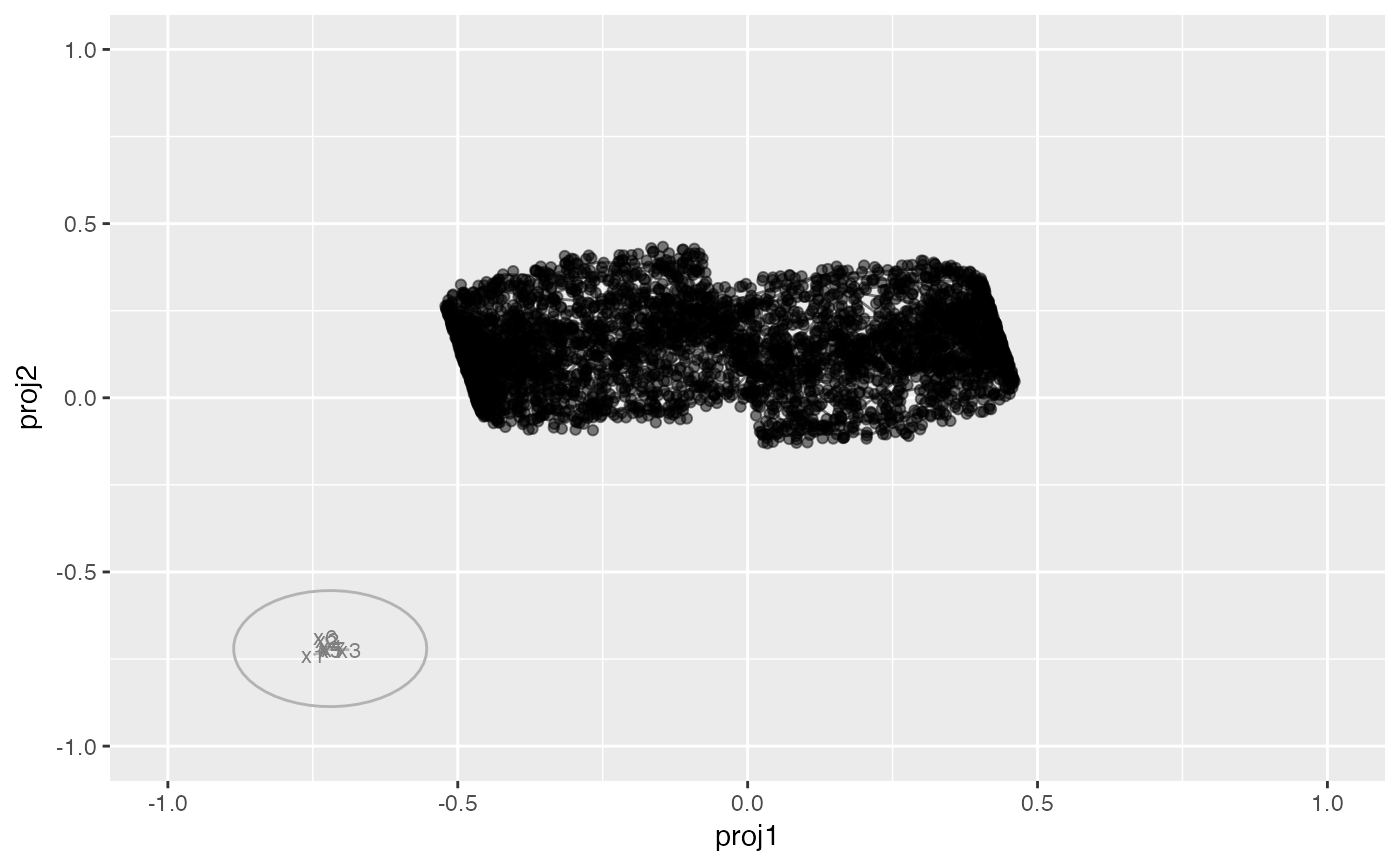
Plot Projected Data with Axes and Circles
Arguments
- proj_obj
An object contains a tibble containing the projected data, a tibble containing the model reference data, a list specifying the axes details, and a list defining circle parameters.
- point_param
A vector specifying point size, alpha, and color (default: c(1, 0.3, "#66B2CC")).
- line_param
A vector specifying line width, alpha, and color (default: c(0.5, 0.5, "#000000")).
- plot_limits
Limits for the plot axes.
- axis_text_size
Size of axis text (default: 3).
- is_category
Logical indicating if the data is categorical (default: FALSE).
Examples
projection_df <- cbind(
c(-0.17353,-0.02906,0.19857,0.00037,0.00131,-0.05019,0.03371),
c(-0.10551,0.14829,-0.02063,0.02658,-0.03150,0.19698,0.00044))

df_bin <- scurve_model_obj$model_highd
edge_data <- scurve_model_obj$trimesh_data

proj_obj1 <- get_projection(projection = projection_df,
highd_data = scurve, model_highd = df_bin,
trimesh_data = edge_data,
axis_param = list(limits = 1, axis_scaled = 3, axis_pos_x = -0.72,
axis_pos_y = -0.72, threshold = 0.09))
#> New names:
#> • `` -> `...1`
#> • `` -> `...2`
#> New names:
#> • `` -> `...1`
#> • `` -> `...2`

plot_proj(proj_obj = proj_obj1, plot_limits = c(-1, 1))